
XAU/USD Market Analysis
Current Price Action and Key Levels
As of the latest data, XAU/USD is trading at $4,358.98, slightly up from the previous close of $4,354.62, marking a 0.10% change. The price has seen a high of $4,367.70 and a low of $4,350.26 in today's session.
Key support levels are found at $4,350 and $4,340, while immediate resistance is seen around $4,370 and $4,380. A sustained break above $4,370 could indicate bullish momentum, while a drop below $4,340 may lead to further bearish pressure.
Technical Analysis
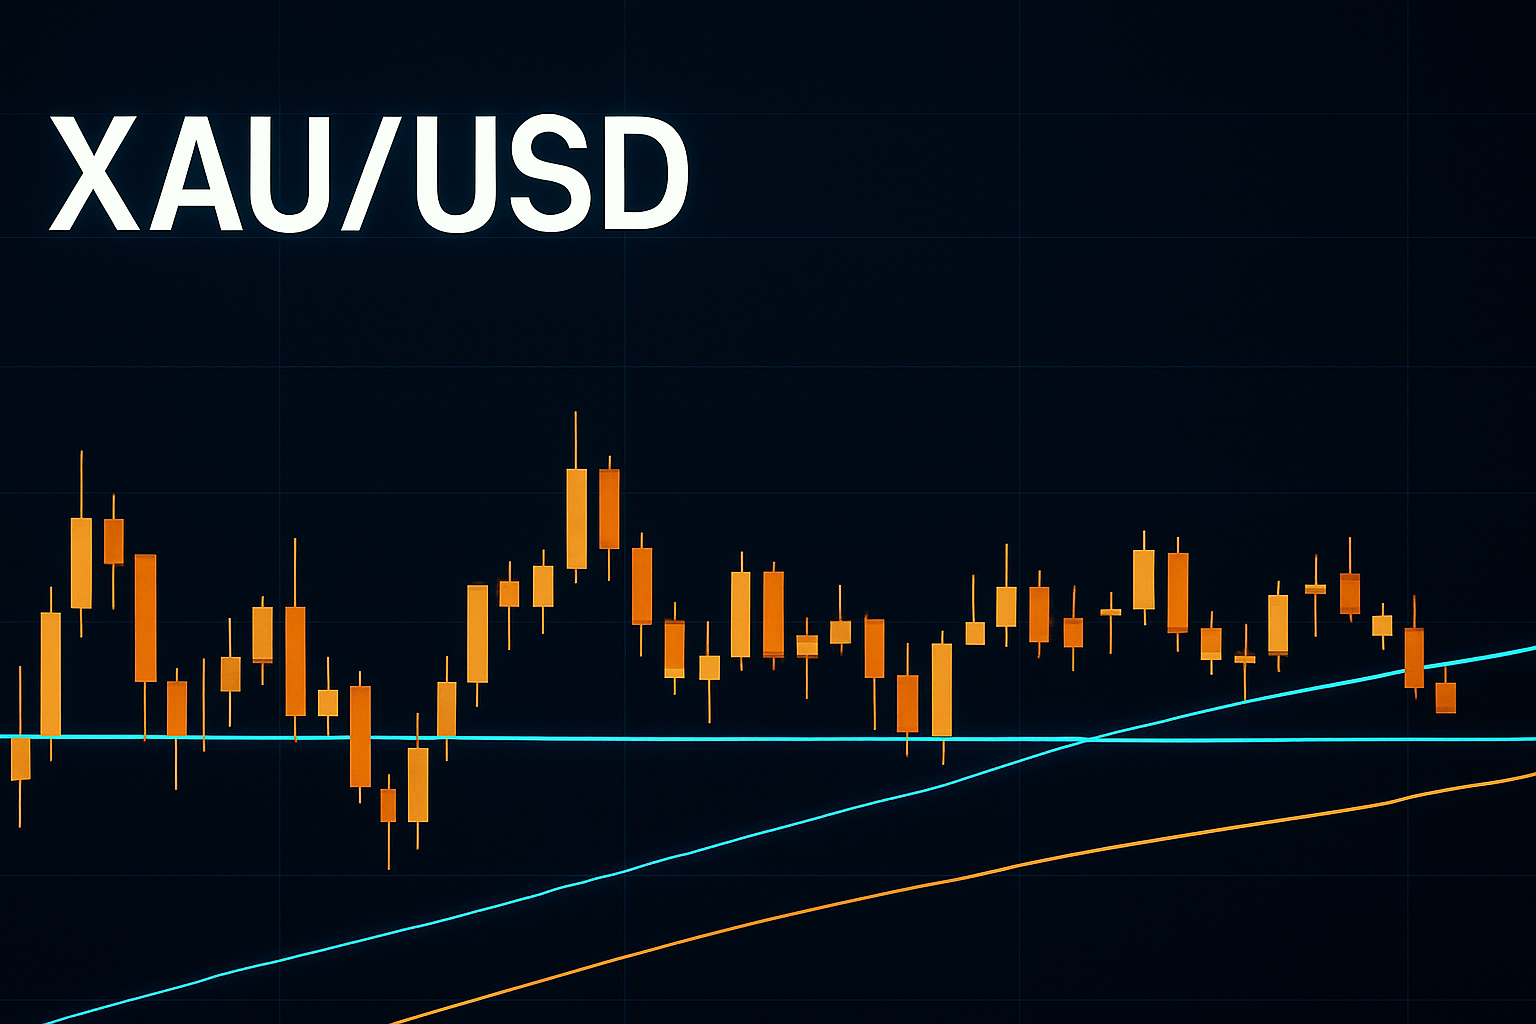
From a technical standpoint, XAU/USD appears to be consolidating within a narrow range, suggesting indecision among traders. The recent price action has formed a potential ascending triangle pattern, with higher lows indicating bullish sentiment, but the lack of a breakout confirms that momentum is yet to solidify.
The Relative Strength Index (RSI) currently hovers around 55, suggesting that the market is neither overbought nor oversold, which supports the idea of a potential breakout if buying pressure increases. Similarly, moving averages indicate a neutral trend, with the short-term 50-day MA crossing above the 200-day MA, which often signals a bullish trend. However, the momentum is not strong enough at this point to confirm a decisive move.
Fundamental/News Context
Recent headlines highlight the cautious outlook among gold traders. Analysts emphasize the need for oil prices and U.S. yields to remain lower for gold buyers to gain traction. This context is critical as fluctuations in these markets can significantly impact gold prices.
Furthermore, the long-term forecast hints at potential rate hikes by the Federal Reserve, which historically has an inverse relationship with gold prices. The anticipation of higher interest rates may weigh on gold; however, the recent rebound above $4,300 after previous rate hikes indicates resilience in the gold market.
Bias and Short-Term Outlook
Considering the current price action, technical indicators, and fundamental backdrop, the bias for XAU/USD remains neutral in the short term. Traders should watch for a breakout above $4,370 to shift the bias towards bullishness, while a break below $4,340 could lead to a bearish outlook.
Key Levels to Watch
- Support Levels: $4,350, $4,340
- Resistance Levels: $4,370, $4,380
In conclusion, traders should remain vigilant as we await confirmation from the market. A clear breakout could pave the way for a more defined trend; hence, monitoring these key levels will be crucial in the coming sessions.