
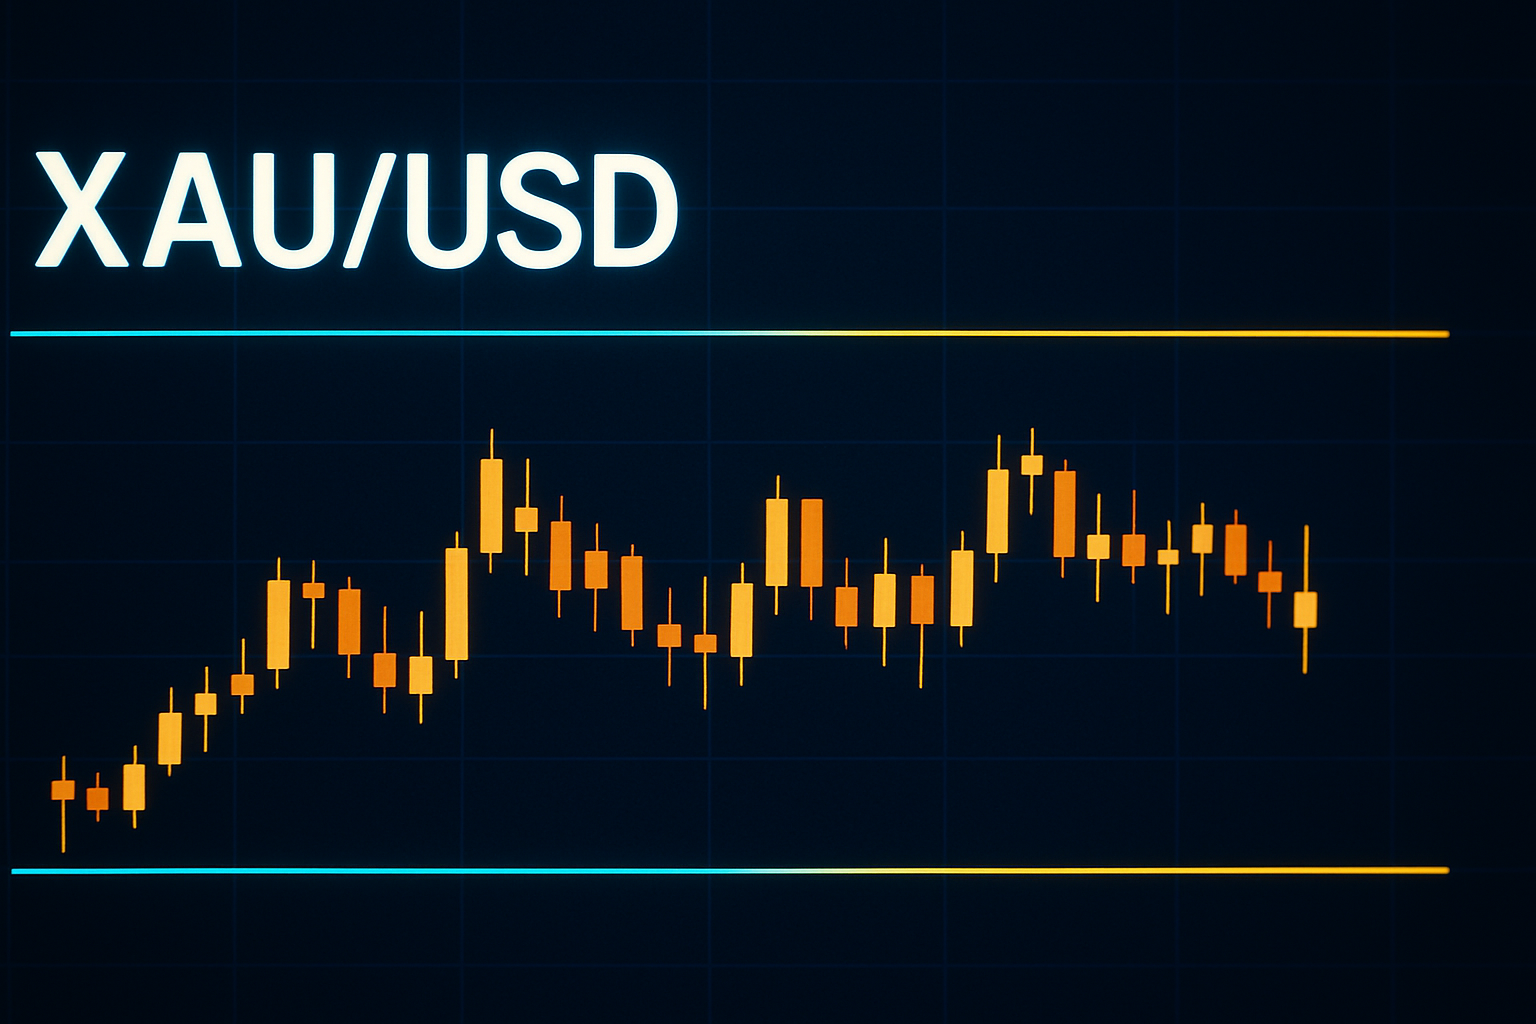
Current Price Action and Key Levels
As of the latest data, XAU/USD is trading at 4435.42, reflecting a slight increase of 0.10% from the previous close of 4430.98. Over the session, gold has experienced a low of 4426.55 and a high of 4444.29. The key levels to monitor are:
- Support: 4426.55 (recent low) and 4400 (psychological level)
- Resistance: 4444.29 (recent high) and 4450 (previous resistance)
These levels provide crucial insight into potential price action as traders look for breakouts or reversals around these points.
Technical Analysis
The current trend indicates a possible bullish outlook with a focus on the recent high of 4444.29. The price action has shown a series of higher lows, suggesting a bullish trend may be developing. Momentum indicators, such as the Relative Strength Index (RSI), are hovering around the neutral zone, indicating that while there may be buying interest, the market lacks strong momentum at this point.
Additionally, the Elliott Wave analysis suggests a minimum of a three-wave rally, which aligns with the observed price action. If the price can maintain above the support level of 4426.55, it may pave the way for a test of the resistance level at 4444.29.
Fundamental/News Context
Recent headlines indicate a mixed sentiment in the gold market. The article titled "Gold Forecast: Is the US Dollar Debasement Trade Dead?" raises questions about the sustainability of gold's safe-haven appeal in an environment where the dollar's strength could diminish. Additionally, the Elliott Wave Outlook suggests that traders are anticipating upward movement, but the overall context remains challenging.
Furthermore, the Technical Outlook for various assets, including gold, suggests that traders should remain cautious, with volatility likely as market dynamics change. The pivot points overview indicates potential reversal zones, which may affect gold's short-term trajectory.
Bias
Given the current price action, technical indicators, and the mixed signals from fundamental news, I hold a neutral bias on XAU/USD. While there is potential for a bullish rally based on Elliott Wave theory and the observed trend, resistance levels, and market sentiment could hinder significant upward movement in the short term.
Key Levels to Watch and Short-Term Outlook
In the short term, traders should closely monitor the support at 4426.55 and the resistance at 4444.29. A breakout above the resistance level could signal a more robust bullish momentum, potentially targeting the 4450 mark. Conversely, a drop below 4426.55 would indicate bearish pressure and could lead to a test of the 4400 psychological support.
In conclusion, while XAU/USD is showing signs of positive momentum, traders should remain vigilant of the resistance levels and broader market sentiment as they navigate potential trading opportunities.