Price Action
XAG/USD is currently trading at 64.78, having opened at 64.65044 and reached a high of 65.1039 before retreating. The low for the session was 64.4561, indicating a tight range with notable selling pressure. The recent price action shows a bearish drift following a failure to maintain momentum above key resistance levels. Candlestick patterns indicate indecision, with a potential bearish engulfing pattern forming, suggesting that market participants are looking to push prices lower.
Key Support & Resistance
Key levels to watch for XAG/USD include:
- Support Levels:
- 64.50: This is a critical psychological level that has previously held strong as support. A break below could signal further downside.
- 64.00: A secondary support level that may provide additional buying interest.
- Resistance Levels:
- 65.10: The recent high, which will act as immediate resistance.
- 65.50: A key level to watch for a potential bounce back if prices recover.
Technical Indicators
Moving Averages
- The 20 EMA is currently positioned at 64.85, serving as a dynamic resistance level.
- The 50 EMA sits at 65.20, indicating a bearish crossover as the price remains below this level.
- The 200 EMA is at 66.00, illustrating the long-term bearish trend that XAG/USD is currently in.
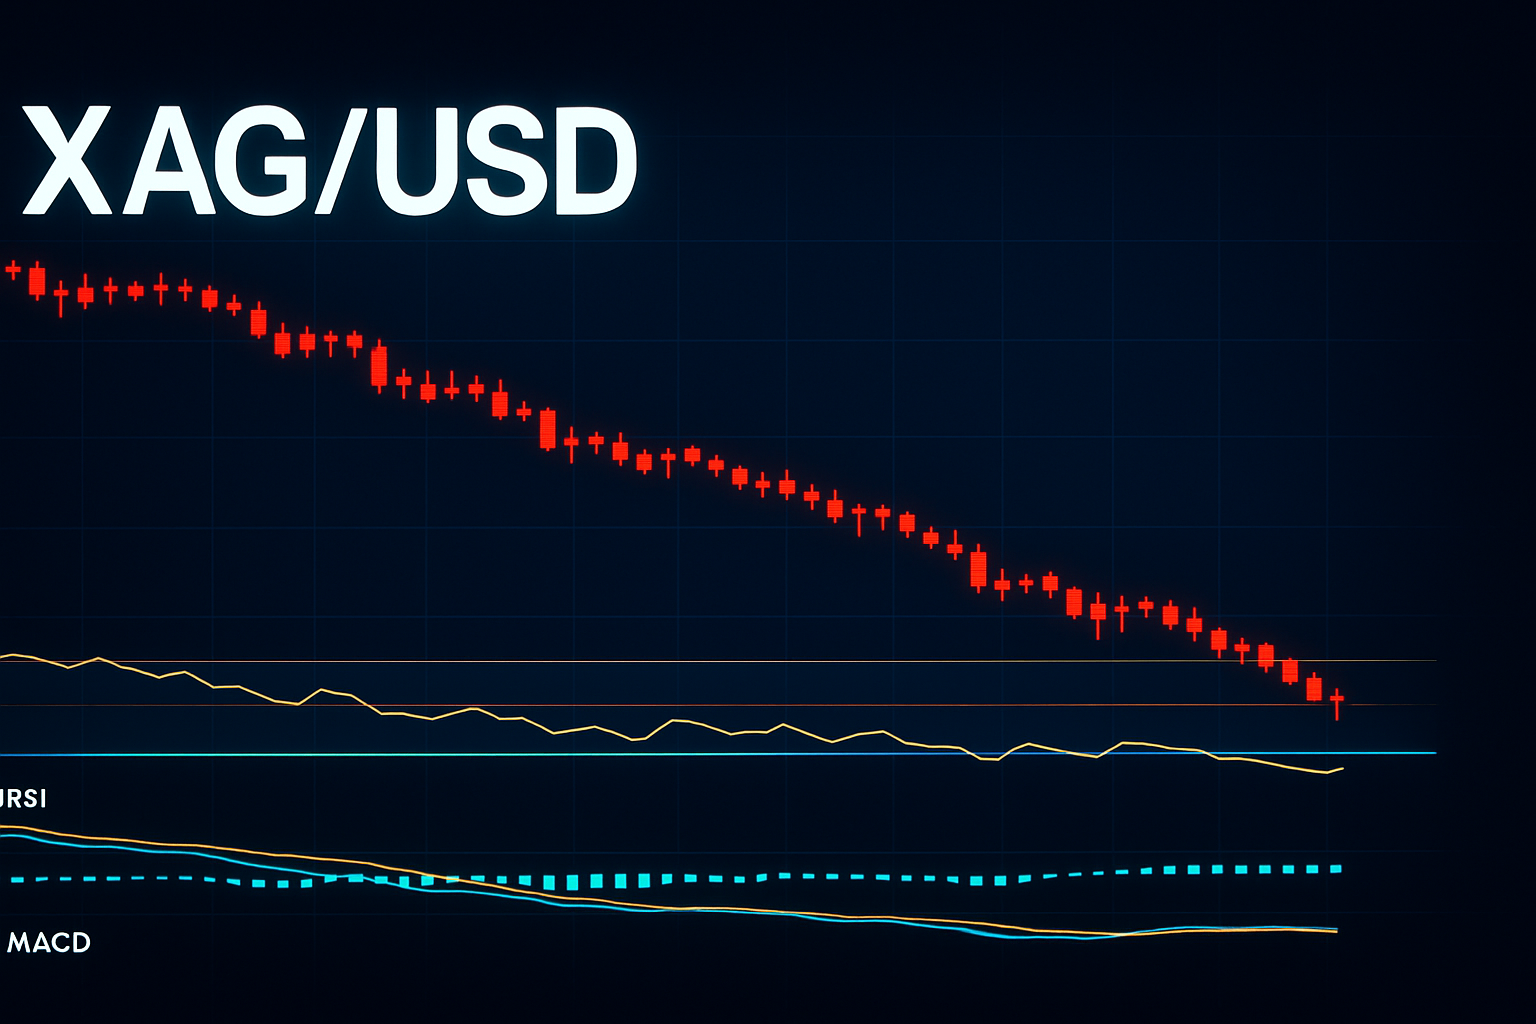
RSI and MACD
- The RSI is currently at 42, suggesting that XAG/USD is nearing oversold territory but still has room to decline before a potential reversal occurs.
- The MACD is in negative territory, indicating that bearish momentum is still in play, with the MACD line below the signal line.
Fibonacci Retracement
The recent swing high at 65.10 and swing low at 64.45 provide a Fibonacci retracement level to watch:
- 23.6% Level: 64.75 (near current price)
- 38.2% Level: 64.90
- 61.8% Level: 64.55 (aligns closely with support)
Trading Setup
Given the current market structure, a short position could be considered if XAG/USD breaks below 64.50 with a target towards 64.00. Conversely, if the price holds at 64.50 and shows signs of a bullish reversal (e.g., a strong bullish candlestick), a potential long entry could be initiated towards 65.10 or even 65.50. Key points to monitor include:
- Confirming a break below 64.50 for a bearish setup.
- Watching for bullish reversals at 64.50 for long entries.
- Keeping an eye on RSI for potential divergence indicating buying momentum.
Traders should remain cautious given the overall bearish sentiment and external market factors affecting precious metals, including recent volatility in gold prices.