
Price Action
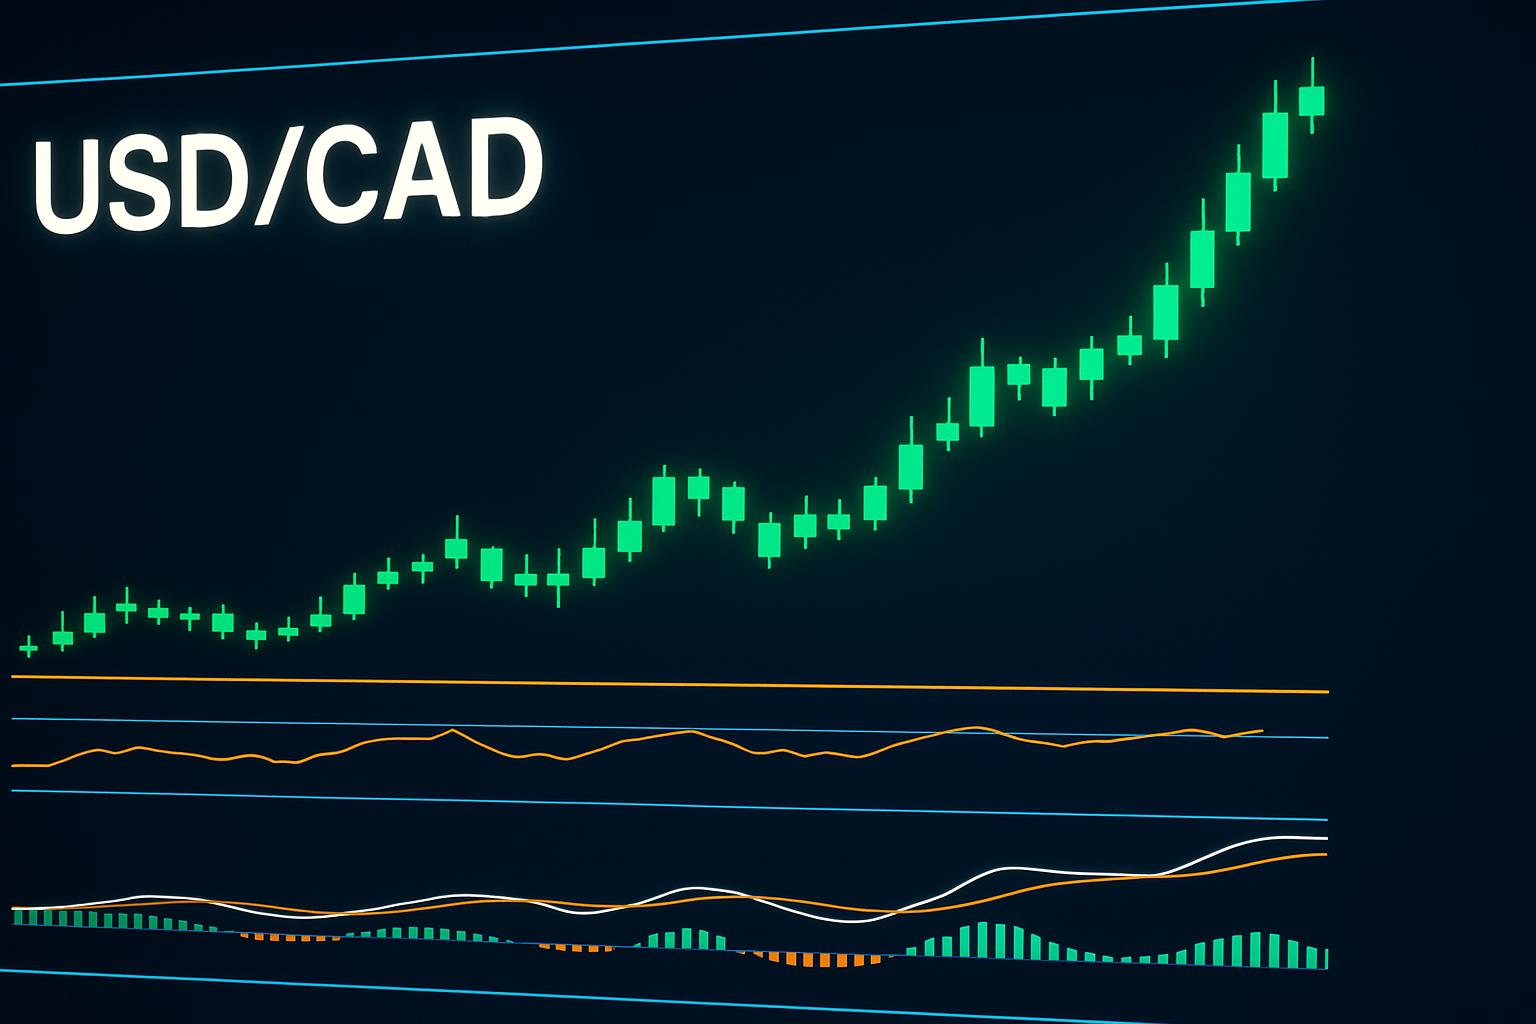
The USD/CAD has shown notable volatility recently, with the current price at 1.3979, a slight increase of 0.10% from the previous close of 1.3965. Over the past trading session, the pair reached a high of 1.4007, testing the critical resistance at 1.40 before pulling back slightly. The recent price movements suggest indecision in the market as traders react to comments from the Federal Reserve and the Bank of Canada.
Recent Candlestick Patterns
- The last few trading days have produced a series of doji candlesticks, indicating market uncertainty.
- A bearish engulfing pattern at the 1.4006 level might signal an impending reversal if confirmed by subsequent price action.
Key Support & Resistance
In terms of key levels, the following support and resistance zones are crucial for traders:
- Support Levels:
- 1.3950: A psychological level that has provided support in the past.
- 1.3920: The next significant support level below the current price.
- Resistance Levels:
- 1.4000: A critical psychological barrier that has proven difficult to breach.
- 1.4030: A previous high that could attract sellers if the price approaches this level again.
Technical Indicators
Moving Averages
- The 20 EMA is currently at 1.3960, acting as immediate support.
- The 50 EMA at 1.3940 provides additional support, while the 200 EMA at 1.3775 indicates a long-term bullish trend.
RSI and MACD
- The RSI (Relative Strength Index) is hovering around 55, suggesting that the market is neither overbought nor oversold, which supports potential bullish momentum.
- The MACD (Moving Average Convergence Divergence) is showing a bullish crossover, indicating potential upward momentum in the near term.
Fibonacci Retracement
- The recent price action has retraced approximately 38.2% of the upward move from the low of 1.3790 to the high of 1.4007, with the Fibonacci level at 1.3950 coinciding with the 20 EMA, reinforcing this support zone.
Trading Setup
Given the current market conditions, traders should consider the following setup:
- Buy Entry: A break above 1.4007 with a target of 1.4030. This should be confirmed by price action and volume.
- Sell Entry: A rejection at 1.4000 or a close below 1.3950 could signal a move towards 1.3920.
- Stop Loss: Positioning a stop loss just below 1.3950 for long positions or above 1.4010 for short positions can help manage risk effectively.
Overall, the USD/CAD remains at a critical juncture, and monitoring these technical indicators alongside market news will be essential for making informed trading decisions.