
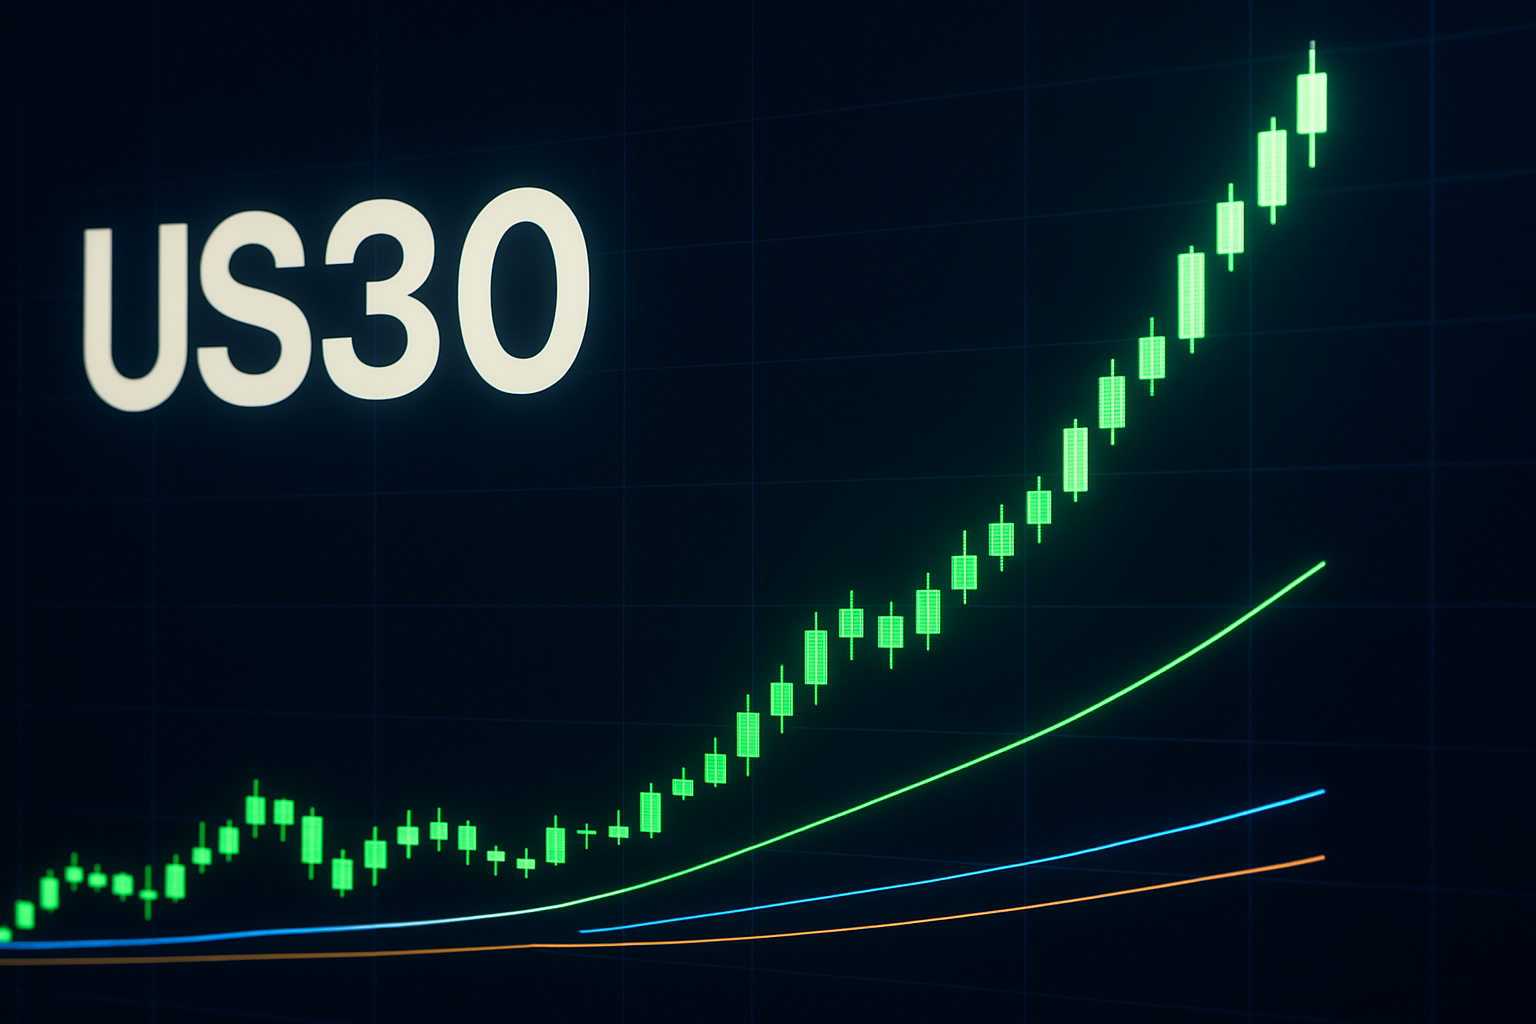
Current Price Action and Key Levels
The US30 index is currently priced at 36, reflecting a slight increase of 0.10% from the previous close of 35.964. The index opened at 35.964, tested a high of 36.072, and found support at a low of 35.928. This price action indicates a consolidation phase as the index oscillates within a tight range.
Key Support Levels:
- 35.928: This level acted as a recent low and presents a potential buying opportunity if tested again.
- 35.800: A psychological level that could serve as a fallback in case of downward pressure.
Key Resistance Levels:
- 36.072: The recent high that traders will need to break through to confirm further bullish momentum.
- 36.200: A significant resistance level that could act as a barrier to further price gains.
Technical Analysis
From a technical standpoint, the US30 is currently consolidating in a sideways trend, indicating indecision among investors. The Relative Strength Index (RSI) is hovering around neutral territory, suggesting a lack of strong momentum in either direction.
Notably, the index appears to be forming a bull flag pattern, which is characterized by a brief consolidation after an upward movement and could suggest a potential breakout to the upside if the pattern holds.
Fundamental/News Context
Recent headlines have focused on forecasts for the Dow Jones index extending into 2026 and beyond, indicating a long-term bullish sentiment among analysts. Additionally, discussions surrounding the NASDAQ and S&P 500 suggest that while the broader market is experiencing fluctuations, the Dow Jones is holding its ground. The confidence in long-term predictions may bolster investor sentiment in the short term as traders look for stability amidst volatility in other indices.
Bias
Given the current price action, the formation of a potential bull flag, and the supportive long-term forecasts, my bias for US30 is bullish. The combination of a stable support level and optimistic market sentiment may create favorable conditions for upward movement.
Key Levels to Watch and Short-Term Outlook
Traders should keep a close eye on the resistance at 36.072—a breakout above this level could trigger a rally towards 36.200. Conversely, if the price falls below the support at 35.928, it may indicate a bearish reversal, necessitating caution.
In the short term, expect the US30 to remain within this range as traders digest economic data and news headlines. A decisive break above 36.072 could pave the way for further gains, while a drop below the recent low at 35.928 may signal a shift in sentiment. Overall, the outlook remains cautiously optimistic, with a focus on key technical levels.