
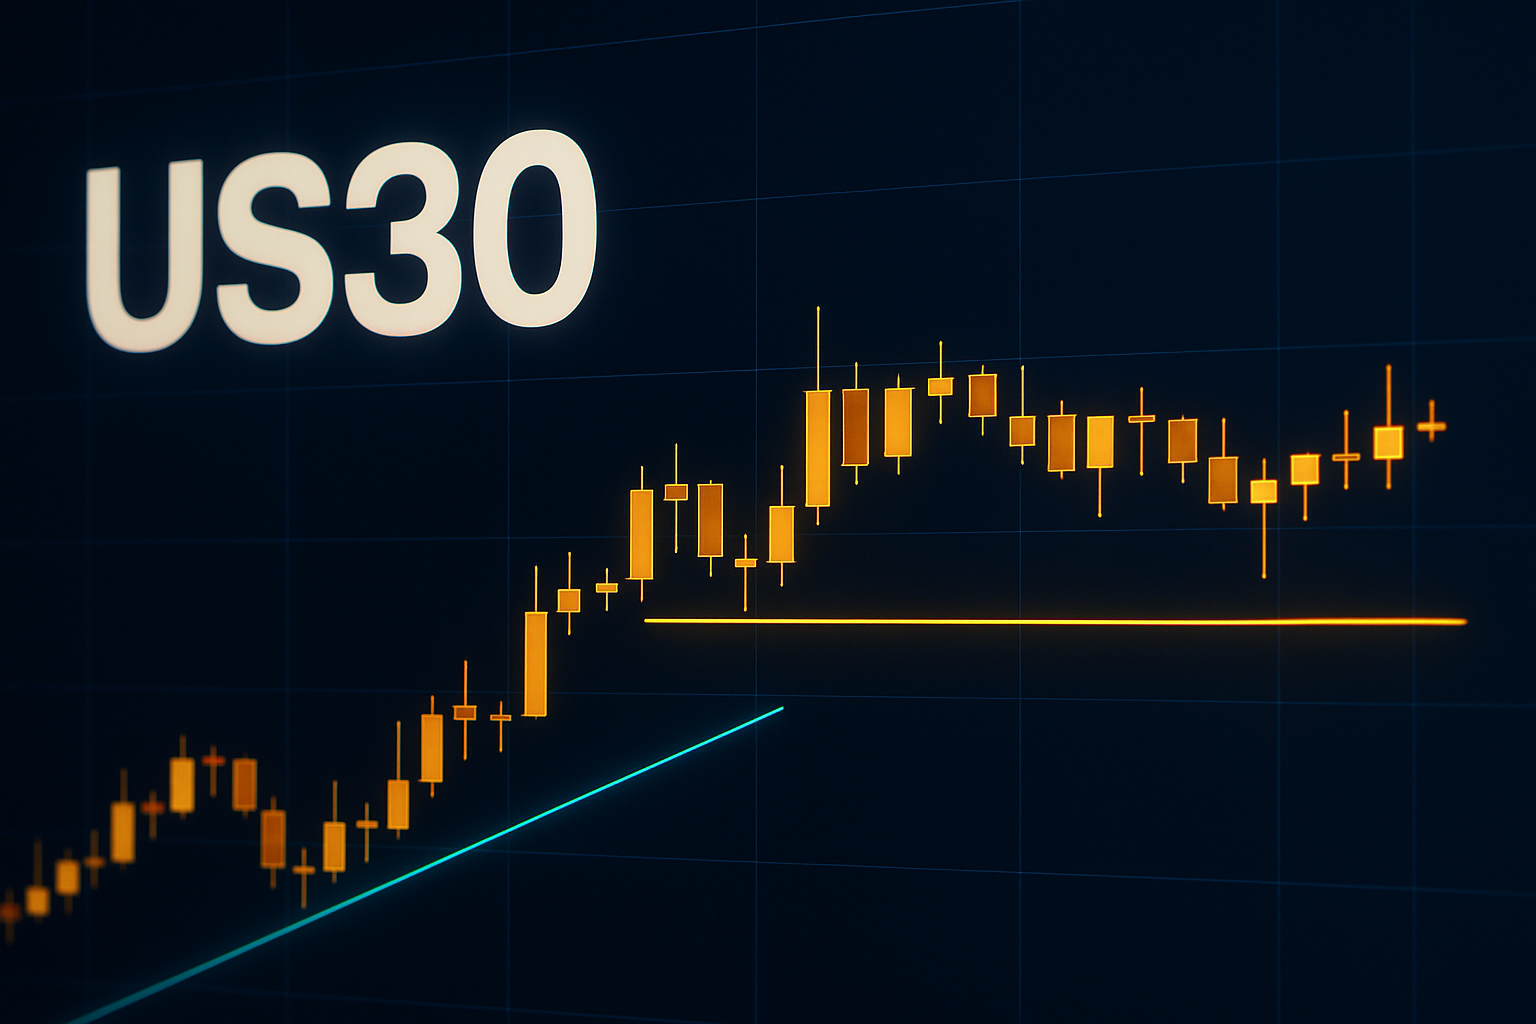
US30 Market Analysis
Current Price Action and Key Levels
The US30, currently trading at 30.00, has shown a slight increase of 0.10% since the previous close at 29.97. The index opened at 29.97 and fluctuated within a narrow range, hitting a high of 30.06 and a low of 29.94. Key levels to monitor include:
- Resistance: 30.06 (recent high)
- Support: 29.94 (recent low)
Technical Analysis
From a technical standpoint, the US30 appears to be in a consolidation phase. The price is hovering near the psychological level of 30.00, which serves as both a support and resistance point. The Relative Strength Index (RSI) is currently around neutral territory, suggesting that momentum is neither strongly bullish nor bearish. However, a breakout above 30.06 could initiate a bullish trend, while failure to maintain support at 29.94 could lead to a bearish reversal.
Notably, the Moving Average Convergence Divergence (MACD) indicates that momentum is waning, which suggests traders should exercise caution when entering new positions. The price action has formed a minor ascending triangle pattern, which could signal a bullish breakout if the index manages to close above 30.06 with strong volume.
Fundamental/News Context
The recent headlines provide a mixed backdrop for the US30. Economic data releases, such as the ISM services index and Fed minutes, are anticipated to influence market sentiment this week. Investors should remain aware of these events, as they can lead to increased volatility.
Furthermore, rising yields, particularly the 5% yield on the 30-year U.S. Treasury, have created a complex environment. While higher yields typically suggest a strong economy, they can also deter investment in equities, as investors seek safer returns in bonds. Additionally, the strength of the South Korean Won against the dollar highlights emerging market dynamics that could be affecting broader investor sentiment.
Concerns over rising oil prices and their impact on inflation could also weigh on market performance, particularly if they lead to increased Federal Reserve hawkishness. The forecast for gold being undermined by these rising yields also suggests a shift in investor focus that could impact equity markets.
Bias and Outlook
Given the current price action and the mixed economic signals, my overall bias for the US30 is neutral. The index is caught between key resistance and support levels, and its future direction will depend heavily on upcoming economic data and geopolitical developments.
Key Levels to Watch
- Immediate Resistance: 30.06
- Immediate Support: 29.94
Short-Term Outlook
In the short term, traders should watch for a breakout above 30.06 for potential bullish momentum or a drop below 29.94, which would signal a bearish trend. Given the current consolidation, a cautious approach is recommended, with attention to fundamental developments that may shift market sentiment.