
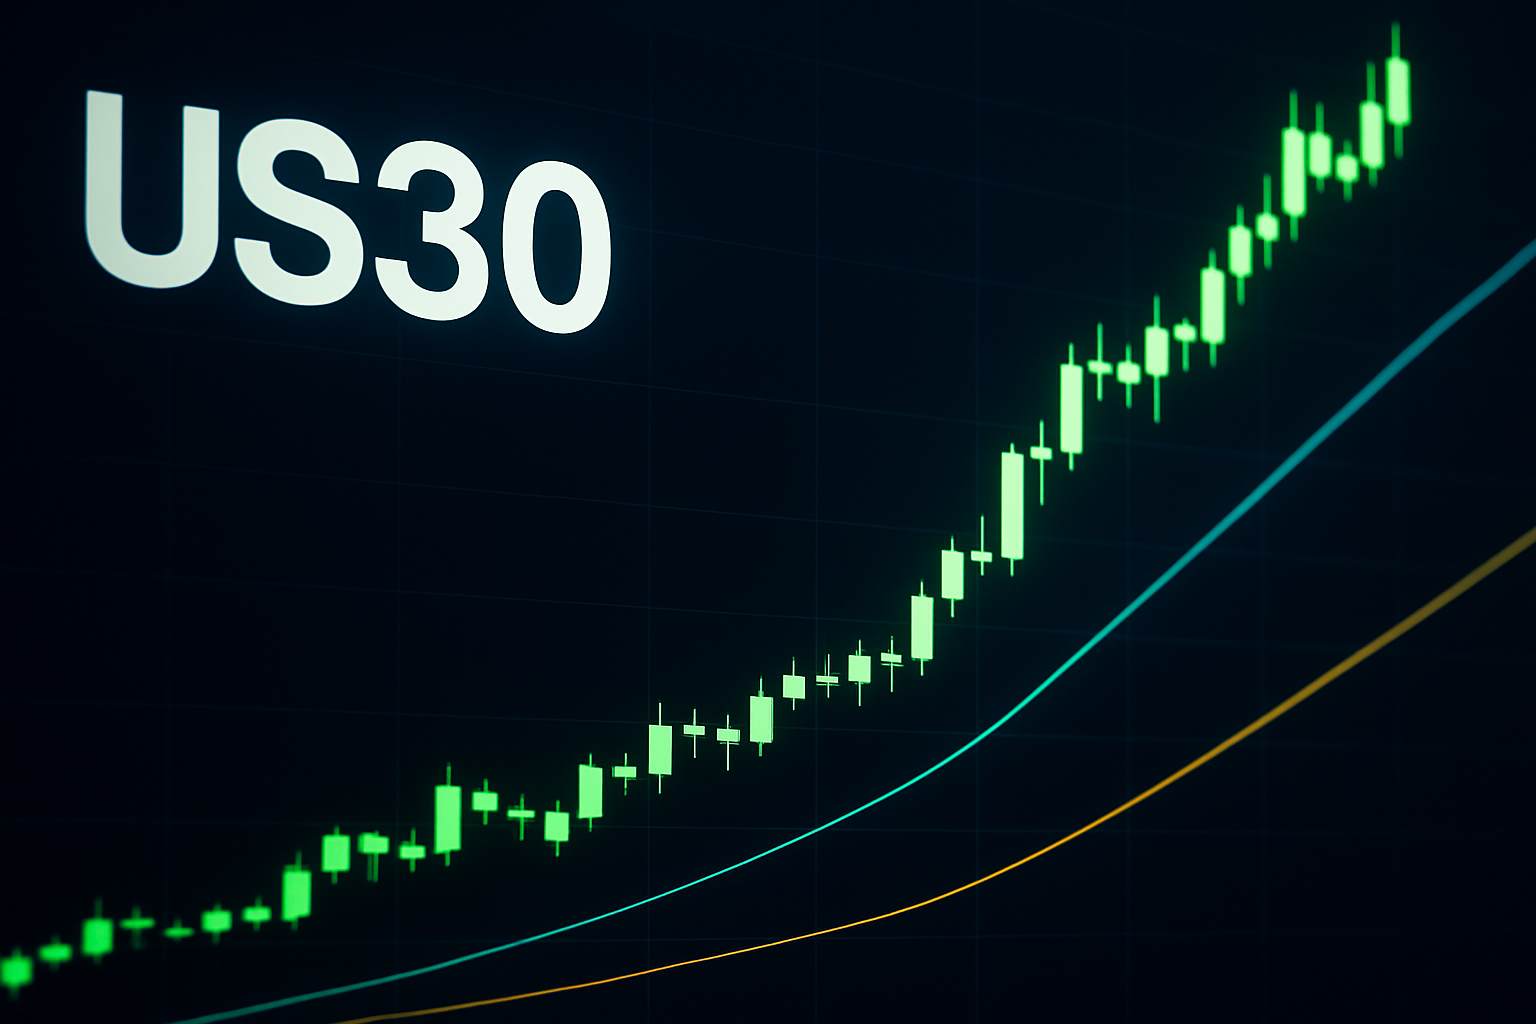
Current Price Action and Key Levels
As of now, the US30 index is trading at 51423, reflecting a slight increase of 0.10% from the previous close of 51371.577. The index opened at 51371.577, showing resilience between its high of 51525.846 and low of 51320.154. The immediate support level can be identified around 51320, while key resistance is noted at 51525, where sellers may emerge as the price approaches.
Technical Analysis
The overall trend for US30 appears bullish in the short term, as it continues to hover near its recent highs. The slight increase in price indicates a potential bullish momentum, especially given that the index is nearing all-time highs, as suggested by recent forecasts. Momentum indicators such as the Relative Strength Index (RSI) are likely moving towards the 60-70 range, confirming the bullish sentiment without indicating overbought conditions just yet. However, traders should monitor for any reversal patterns if the index fails to break above the resistance at 51525.
Fundamental/News Context
Recent headlines suggest a complex backdrop for US30. The U.S. 30-year Treasury yield has reached its highest level since 2004, indicating rising interest rates and potentially increasing borrowing costs, which could weigh on equities. However, the bullish sentiment in the Dow Jones Industrial Average (DJIA) indicates that investors may be looking past short-term volatility. The report on Iran’s seven-day Hormuz deal has likely contributed to a cautious optimism in the markets, though it’s critical to remain aware of geopolitical tensions that could impact market stability. Additionally, the expansion of trading tools and alerts from SureShotFX may reflect a growing interest in automated trading strategies, which could influence market dynamics.
Bias
Given the current market conditions and the prevailing bullish trend, the bias for US30 is bullish. The index's ability to hold above key support levels while approaching significant resistance suggests potential for further upside, barring any negative economic data or geopolitical tensions that might arise.
Key Levels to Watch and Short-Term Outlook
In the short term, traders should focus on the following key levels:
- Support: 51320
- Resistance: 51525
A successful breakout above 51525 could propel the index toward new highs, potentially targeting the psychological level of 52000. Conversely, if the index fails to break above this resistance and drops below 51320, it could signal a trend reversal and open up the possibility for a deeper pullback towards 51000. Traders should stay vigilant and prepare for market reactions to upcoming economic indicators that could influence the broader sentiment.