
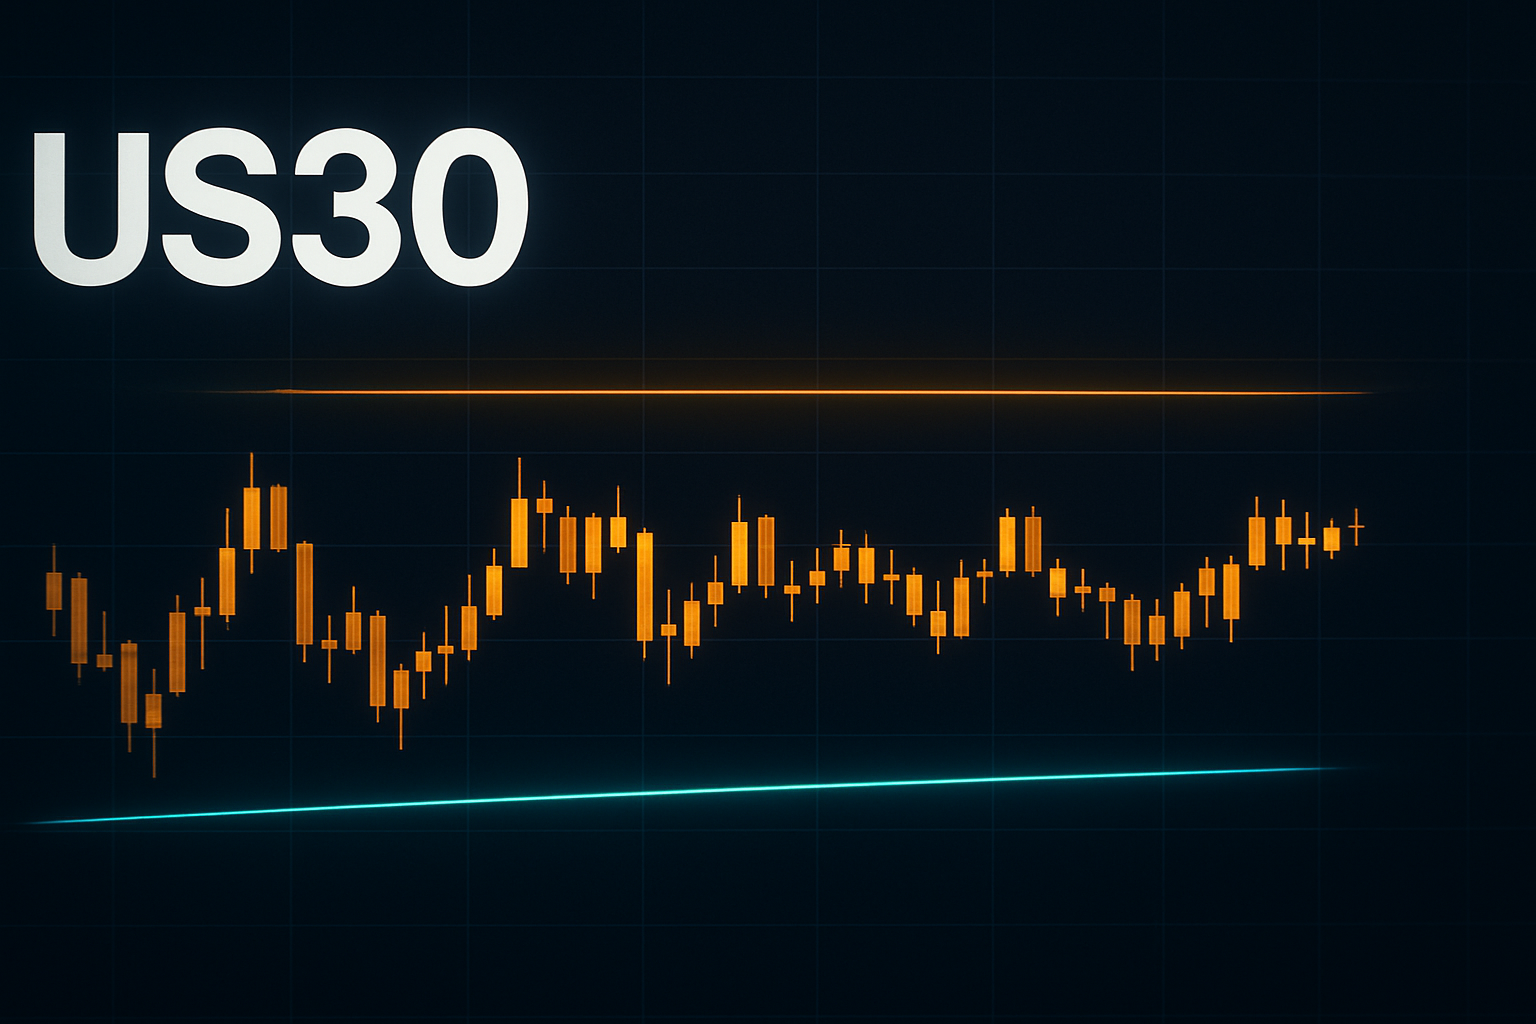
Current Price Action and Key Levels
The US30 index currently trades at 185, reflecting a slight 0.10% increase from its previous close of 184.815. Today's session opened at 184.815, with the price reaching a high of 185.37 and dipping to a low of 184.63. This price action indicates a consolidation phase around the 185 level, which has become a significant psychological resistance point.
Support levels can be identified at 184.63 (the low of the day) and further down at 184.00, while resistance is clearly established at 185.37. A decisive break above this level could signal a continuation of bullish momentum.
Technical Analysis
From a technical standpoint, the US30 index is currently exhibiting a neutral to slightly bullish trend. The Relative Strength Index (RSI) is hovering around 55, suggesting that there is room for upward movement without being overbought. Moreover, the index has been forming a series of higher lows, which is a positive sign for the bulls. However, the recent price action indicates hesitance to break above the 185 resistance.
The Moving Average Convergence Divergence (MACD) indicator is also showing bullish divergence, as it is trending upwards while the price has stalled, hinting at underlying strength. Traders should keep an eye on potential bullish patterns forming, such as a breakout from a flag or pennant formation, which could provide a clearer signal for entering long positions.
Fundamental/News Context
The recent news regarding the US 30-year mortgage rate surpassing 7% and hitting a two-year high has significant implications for the broader economic landscape. Higher mortgage rates typically slow down the housing market, which can have a cascading effect on consumer spending and overall economic growth. This environment of tightening credit could weigh on market sentiment, especially if investors anticipate a slowdown in economic activity.
The potential impact of these rising rates could create volatility in equity markets, particularly in sectors sensitive to interest rates. Traders should remain cautious about the broader implications of economic indicators and adjust their strategies accordingly.
Clear Bias
Given the current price action and technical indicators, the bias for the US30 is neutral. While there are bullish signs, the resistance at 185 poses a significant barrier that needs to be overcome for a bullish outlook to gain traction. The recent news on mortgage rates adds a layer of uncertainty, which could influence market sentiment negatively.
Key Levels to Watch and Short-Term Outlook
- Key Resistance: 185.37 - a breakout above this level could lead to a bullish trend targeting the next psychological level of 186.
- Key Support: 184.63 - a break below this level could trigger a bearish sentiment, with targets around 184.00.
In summary, traders should watch for price action around the 185 level closely. A breakout could signal a potential rally, whereas a failure to hold above this level could lead to renewed selling pressure. Stay informed of economic releases and market sentiment as they will be crucial in shaping the direction of the US30 in the coming sessions.