
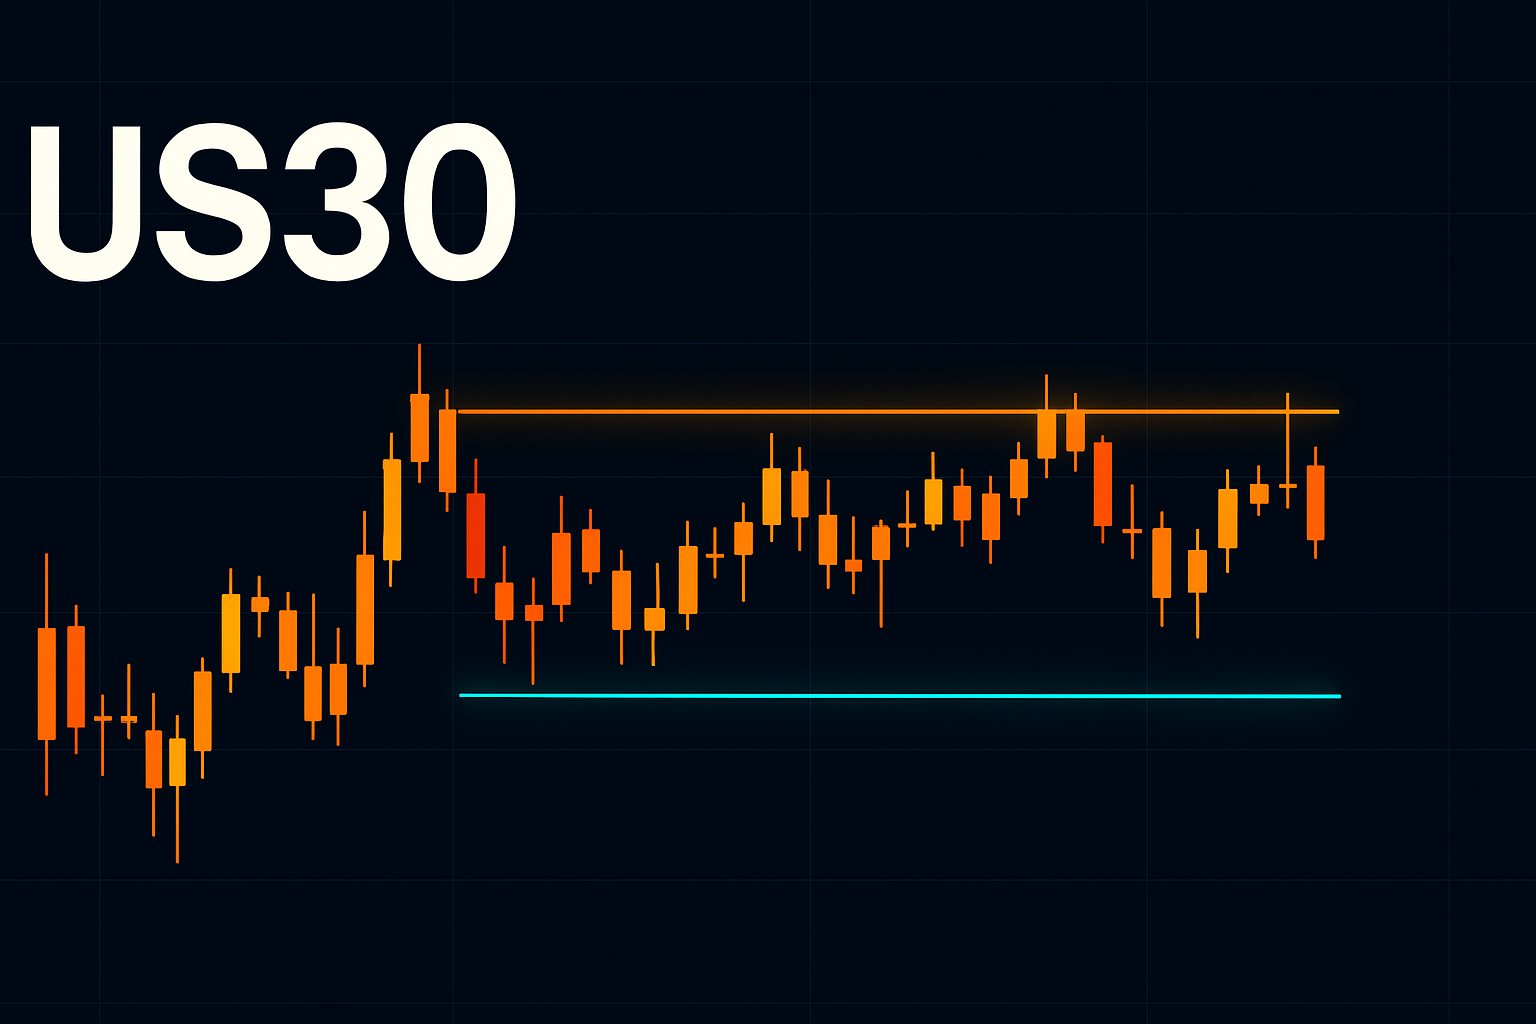
Current Price Action and Key Levels
As of the latest trading session, US30 is trading at 322, showing a minor increase of 0.10% from the previous close of 321.678. The index opened at 321.678, reached a high of 322.644, and tested a low of 321.356. Currently, the price is hovering near key resistance levels, suggesting potential indecision among traders.
Key support levels to watch are located around 321.356 and 320.500, while immediate resistance is observed at 322.644. A breakout above this resistance could signal a continuation of bullish momentum, while a drop below 321.356 may lead to further selling pressure.
Technical Analysis
From a technical standpoint, US30 is currently exhibiting a neutral to bullish trend. The price is maintaining itself above the 50-period simple moving average (SMA), indicating a stronger bullish posture in the medium term. However, momentum indicators, such as the Relative Strength Index (RSI), are approaching the overbought territory (around 70), suggesting that a pullback may be imminent if the index does not break through resistance convincingly.
Moreover, the price action over the last few sessions has formed a consolidation pattern, characterized by lower volatility and tighter price ranges. This pattern often precedes a significant move, either upwards or downwards, depending on the breakout direction.
Fundamental/News Context
Interestingly, there are no major news headlines impacting the US30 index currently. The absence of fresh economic data or geopolitical events has resulted in a quieter trading environment. Traders are likely awaiting upcoming economic reports, such as employment data or manufacturing indices, which could provide clearer direction for market sentiment.
In this context, the lack of news catalysts may contribute to the current consolidation phase, where traders are cautious and waiting for more definitive signals before committing to a direction.
Bias
Given the current market dynamics, the bias for US30 is neutral. While the price is trading near resistance, the lack of strong bullish momentum combined with the potential overbought conditions on the RSI suggest that traders should remain cautious. A breakout above 322.644 could provide a bullish signal, while a decline below 321.356 may confirm a bearish scenario.
Key Levels to Watch and Short-Term Outlook
- Key Resistance: 322.644
- Key Support: 321.356, 320.500
In the short term, traders should monitor price action closely around these key levels. A decisive break above resistance could open the door for further gains towards 324.000, while a failure to hold above the support level could trigger a retracement towards 320.000. As we move forward, maintaining a watchful eye on any potential economic news or data releases will be crucial for gauging market sentiment and direction.