
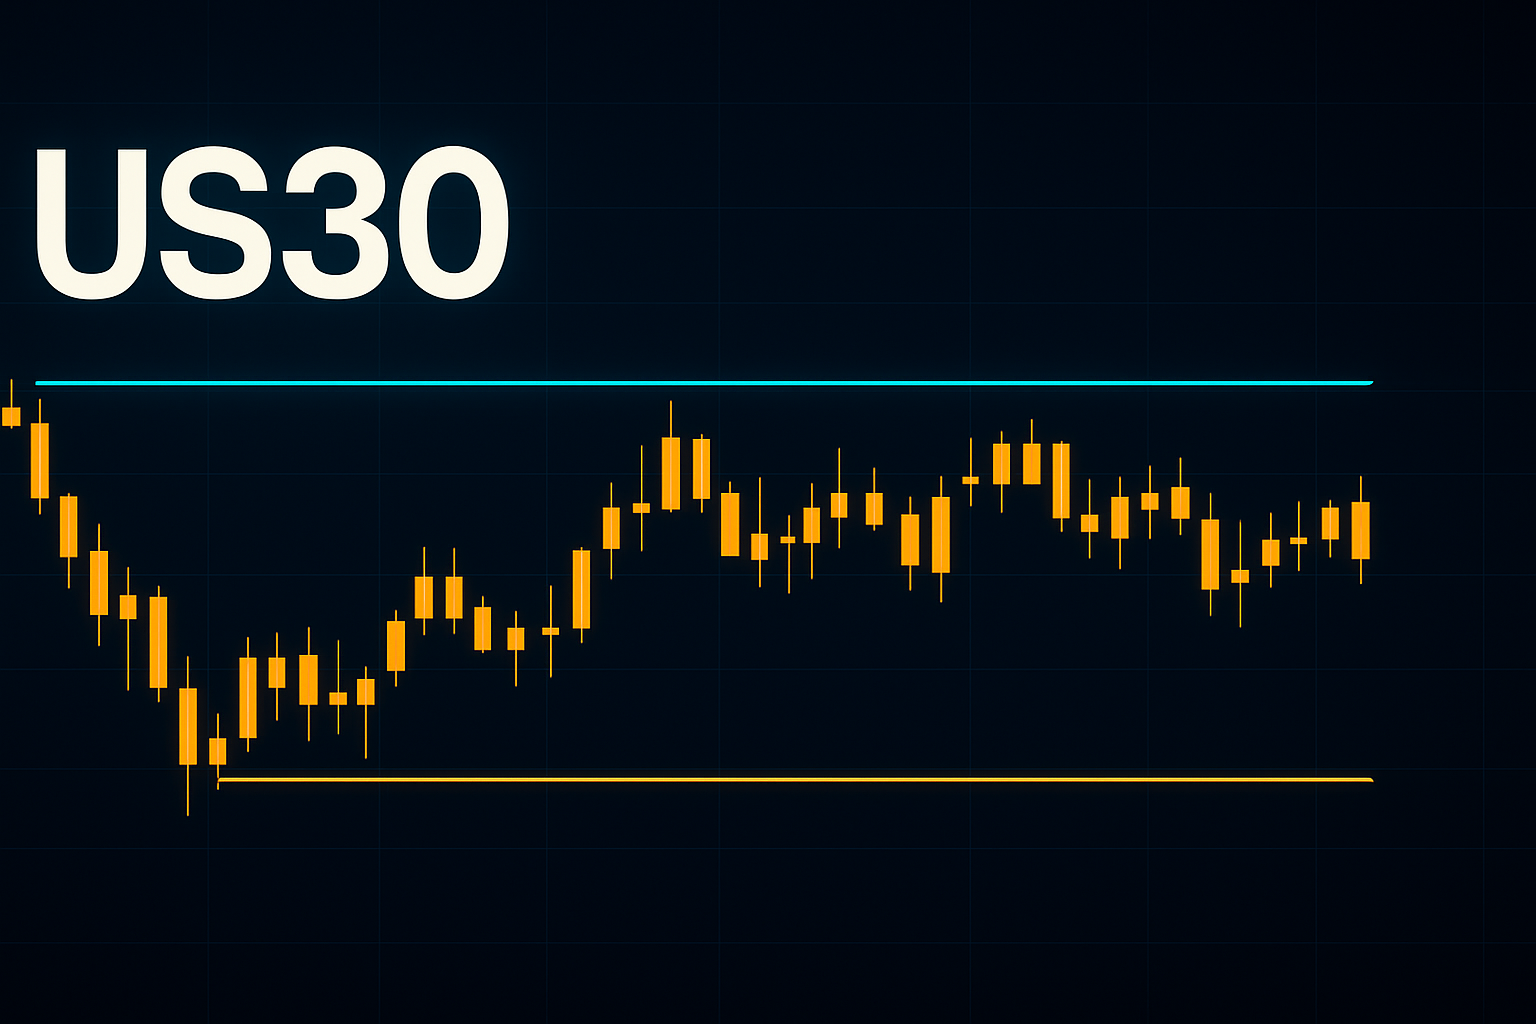
Current Price Action and Key Levels
The US30 index is currently trading at 295, having opened slightly lower at 294.705. The day's high reached 295.59, while the low was recorded at 294.41. The index shows a minor change of 0.10% from the previous close of 294.705, indicating a stagnant market sentiment.
Key Levels:
- Support Level: 294.41 (recent low)
- Resistance Level: 295.59 (recent high)
These levels are crucial as they dictate the short-term movement of the index. A break below the support could suggest bearish sentiment, while a move above resistance may indicate bullish momentum.
Technical Analysis
From a technical perspective, the US30 is currently in a consolidation phase, oscillating around the 295 mark. The Relative Strength Index (RSI) is hovering around the neutral zone (50), indicating a lack of strong momentum in either direction. Additionally, the Moving Average Convergence Divergence (MACD) is showing signs of divergence, suggesting that the index may soon make a decisive move.
Notably, the index has formed a potential double top around the 295.59 resistance level, which could lead to bearish pressure if confirmed with a drop below the recent low of 294.41. However, if the US30 can break above 295.59, we may see a rally towards the next key resistance level near 296.50.
Fundamental/News Context
Recent economic news highlights significant concerns surrounding the US housing market, with the 30-year mortgage rate hitting its highest level in over a year. This increase in mortgage rates can dampen consumer spending and slow down economic growth, leading to potential volatility in the equity markets. Investors are likely to tread cautiously as they assess the implications of rising borrowing costs, which could impact corporate earnings in the near future.
Furthermore, the overall economic data release is expected to be in focus, as any indication of economic slowdown could weigh on market sentiment, especially for indices like the US30 that are sensitive to consumer confidence and spending trends.
Bias
Given the current technical setup and the backdrop of rising mortgage rates, the bias for US30 is neutral. While the index is showing some resilience at the 295 level, the potential for a reversal exists due to external economic pressures. Traders should remain vigilant for a clear breakout or breakdown from the established range.
Key Levels to Watch and Short-Term Outlook
- Key Resistance: 295.59
- Key Support: 294.41
In the short term, traders should watch for price action around these key levels. A close above 295.59 could confirm a bullish trend towards higher resistance levels, while a drop below 294.41 would reinforce a bearish outlook, potentially leading to lower targets. Keeping an eye on economic data releases and mortgage rate developments will be essential for navigating the upcoming sessions effectively.