
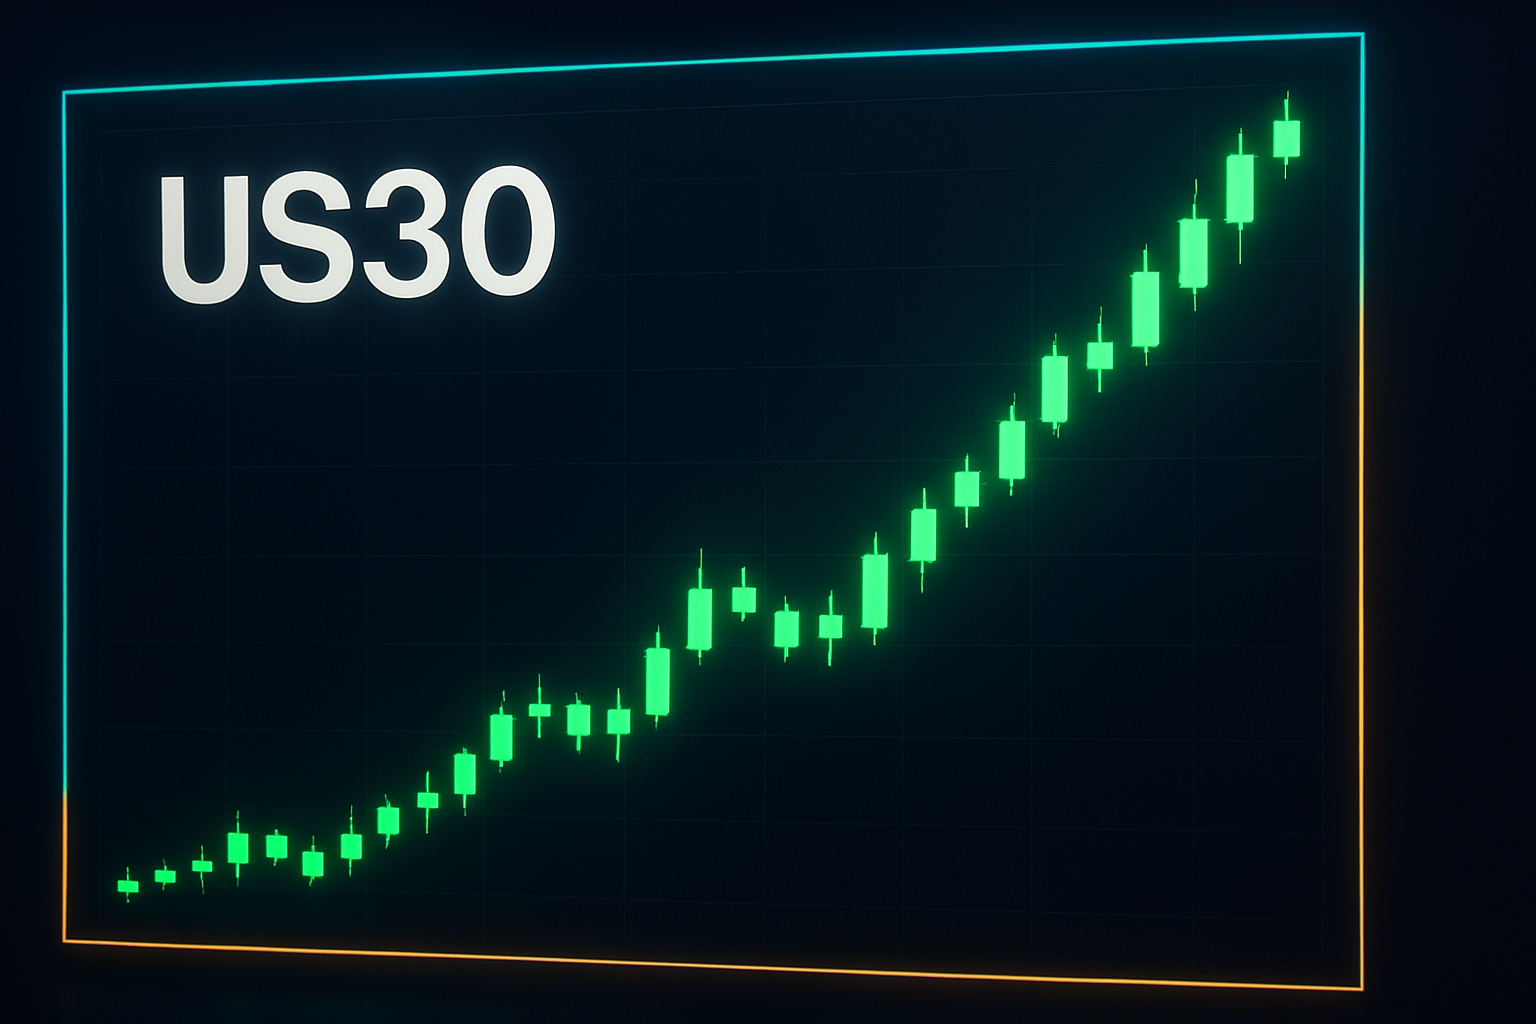
Current Price Action and Key Levels
As of the latest trading session, the US30 index is priced at 51,888.95, showing a modest increase of 0.10% from the previous close of 51,837.06105. The index has recently experienced a high of 51,992.7279 and a low of 51,785.1721. The immediate support level appears to be around 51,785, which aligns with the recent low, while resistance is clearly defined at 51,990 near the recent peak. A breakout above this resistance level could signal further bullish momentum, while a drop below support could indicate a reversal.
Technical Analysis
From a technical standpoint, the US30 is currently in a consolidative phase after a recent move upward. The price maintains a slight upward trend, supported by the recent higher low at 51,785. The Relative Strength Index (RSI) is hovering around 55, suggesting that momentum is still positive but not excessively overbought. This indicates room for further upside potential, especially if the index can clear the 51,990 resistance. Any bearish divergence or a drop below 51,785 could shift sentiment and lead to a bearish outlook.
Fundamental/News Context
Recent headlines indicate a mixed sentiment in the broader market. European markets closed mixed as traders digest the implications of new UK leadership, which could have ripple effects on global sentiment. Additionally, the upcoming 2026 US DST Trading Hours Update suggests changes in trading practices that may impact market dynamics. The crypto market is showing bullish momentum, which often correlates with increased risk appetite among investors. On the other hand, the discussions regarding the Indian Rupee as an international currency may also influence foreign investment flows into the US markets, adding a layer of complexity to the current trading environment.
Bias
Given the current technical setup and the mixed fundamental backdrop, my bias leans towards bullish. The US30's ability to hold above the critical support level of 51,785 while testing the 51,990 resistance could set the stage for a further rally. However, traders should remain cautious of external geopolitical factors and domestic economic indicators that may introduce volatility.
Key Levels to Watch and Short-Term Outlook
- Support Level: 51,785
- Resistance Level: 51,990
In the short term, if the US30 successfully breaks above 51,990, the next target could be around 52,200, which would represent a significant psychological level. Conversely, a failure to maintain above the support level of 51,785 may prompt a reevaluation of bullish strategies, with potential targets shifting lower. Monitoring global market sentiment and any relevant economic data releases will be crucial in the coming days as traders position themselves accordingly.