
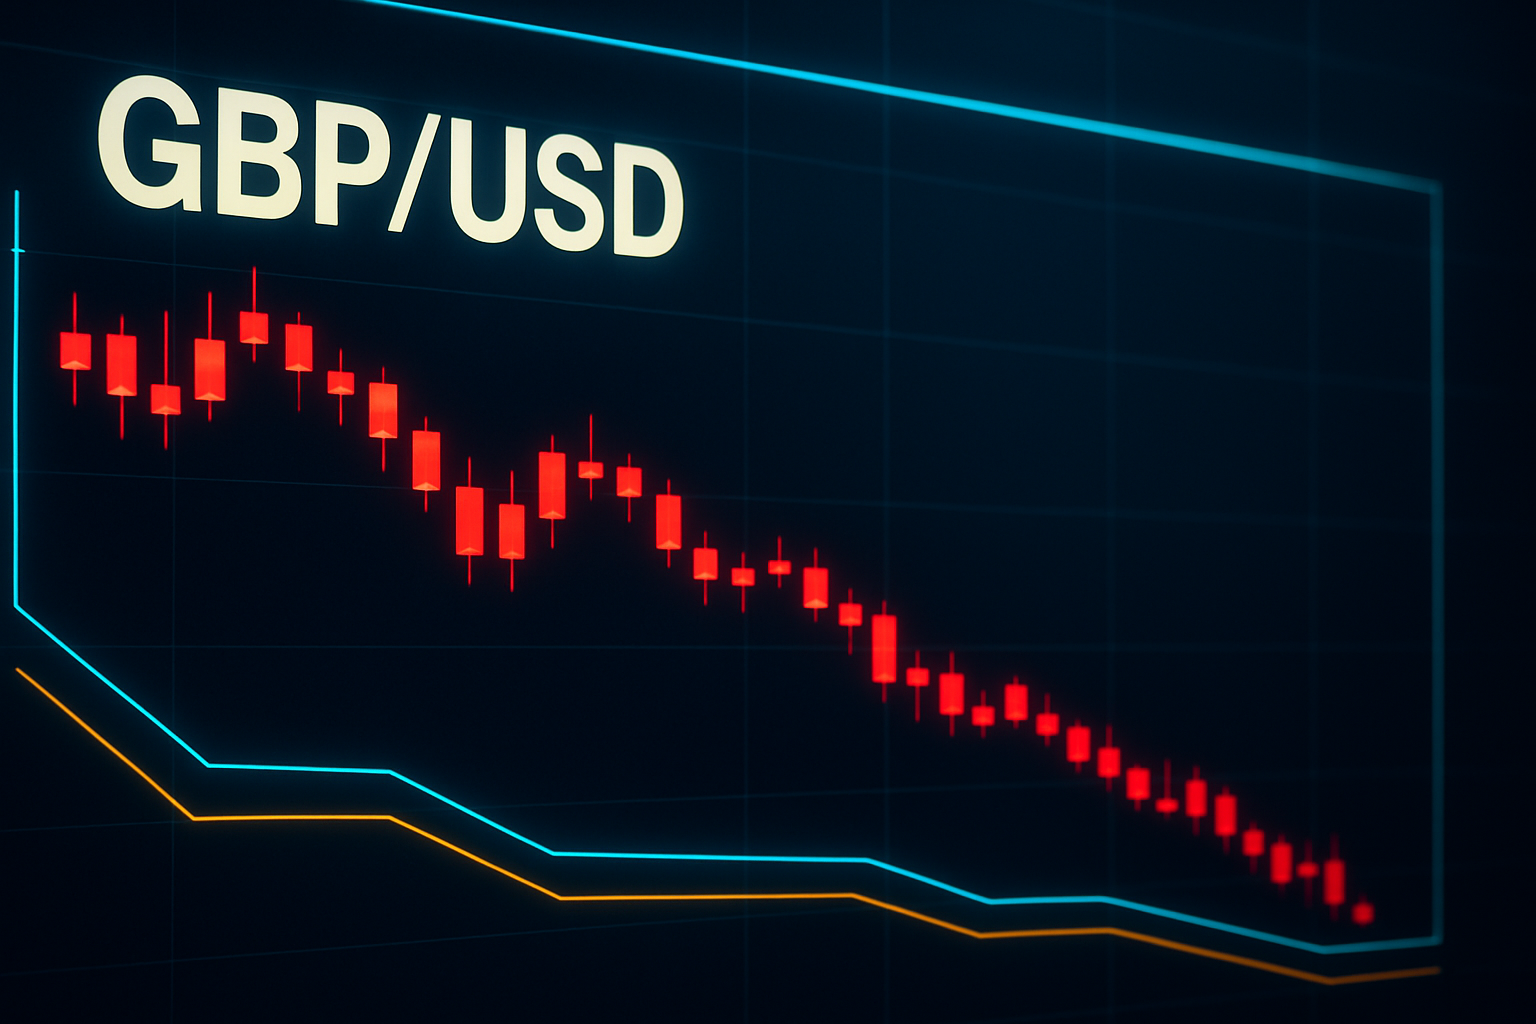
Current Price Action and Key Levels
As of the latest data, GBP/USD is trading at 0.73368, experiencing a modest change of +0.10% from the previous close of 0.73294632. The price opened slightly higher at 0.73294632, but it has seen a high of 0.73514736 and a low of 0.73221264 during the session. The inability to sustain gains above the 0.7350 resistance level suggests a shift in market sentiment, indicating bearish pressure in the near term.
Key support levels to watch include the recent low of 0.7322 and further down at 0.7300, which is a psychologically significant level. On the upside, resistance is evident at 0.7350 and 0.7375, which traders should monitor closely for potential reversals or breakouts.
Technical Analysis
The recent price action reveals that GBP/USD has broken the bullish trend that had been in place for a period, indicating a shift in momentum. The RSI (Relative Strength Index) is currently hovering around 45, suggesting that the pair is neither overbought nor oversold, indicating a potential for further downside.
Additionally, the MACD (Moving Average Convergence Divergence) has turned bearish as the signal line crossed above the MACD line, reinforcing the bearish sentiment. The formation of lower highs in the recent price action could signify the emergence of a downward trend, suggesting that sellers are gaining control.
Fundamental/News Context
Recent headlines have created a negative backdrop for the GBP/USD pair. The article titled "GBPUSD is Under Negative Pressure After Breaking the Bullish Trend" highlights the recent bearish shift in momentum. Additionally, the report on sticky US PCE inflation has further solidified the dollar's strength, keeping the focus on the Federal Reserve's potential rate hikes. As inflation remains a concern, the strengthening of the USD is likely to continue as market participants anticipate further tightening from the Fed.
The combination of technical breakdowns and fundamental pressures from US economic indicators suggests a challenging environment for GBP/USD bulls.
Bias
Given the recent technical breakdown, combined with the fundamental pressures from US inflation data and the Fed's tightening stance, the bias for GBP/USD is bearish. The inability to reclaim key resistance levels further supports this outlook.
Key Levels to Watch and Short-Term Outlook
Traders should keep an eye on the following levels:
- Support: 0.7322 (recent low), 0.7300 (psychological level)
- Resistance: 0.7350 (immediate resistance), 0.7375 (broader resistance)
In the short term, GBP/USD is likely to test the support zone around 0.7322. A decisive break below this level could lead to a further decline towards 0.7300. Conversely, a recovery above 0.7350 would be needed to negate the bearish outlook and signal a potential return to bullish momentum.