
Current Price Action and Key Levels
As of the latest data, EUR/USD is trading at 0.87489, having opened at 0.87401511. The currency pair reached a high of 0.87663978 and a low of 0.8731402199999999 during the trading session. The previous close was 0.87401511, indicating a slight change of +0.10% during the day.
In terms of key levels, immediate resistance can be identified at the recent high of 0.8766. A break above this level could indicate a shift in momentum. Conversely, support is found near the low of 0.8731, which, if breached, may trigger further bearish sentiment.
Technical Analysis
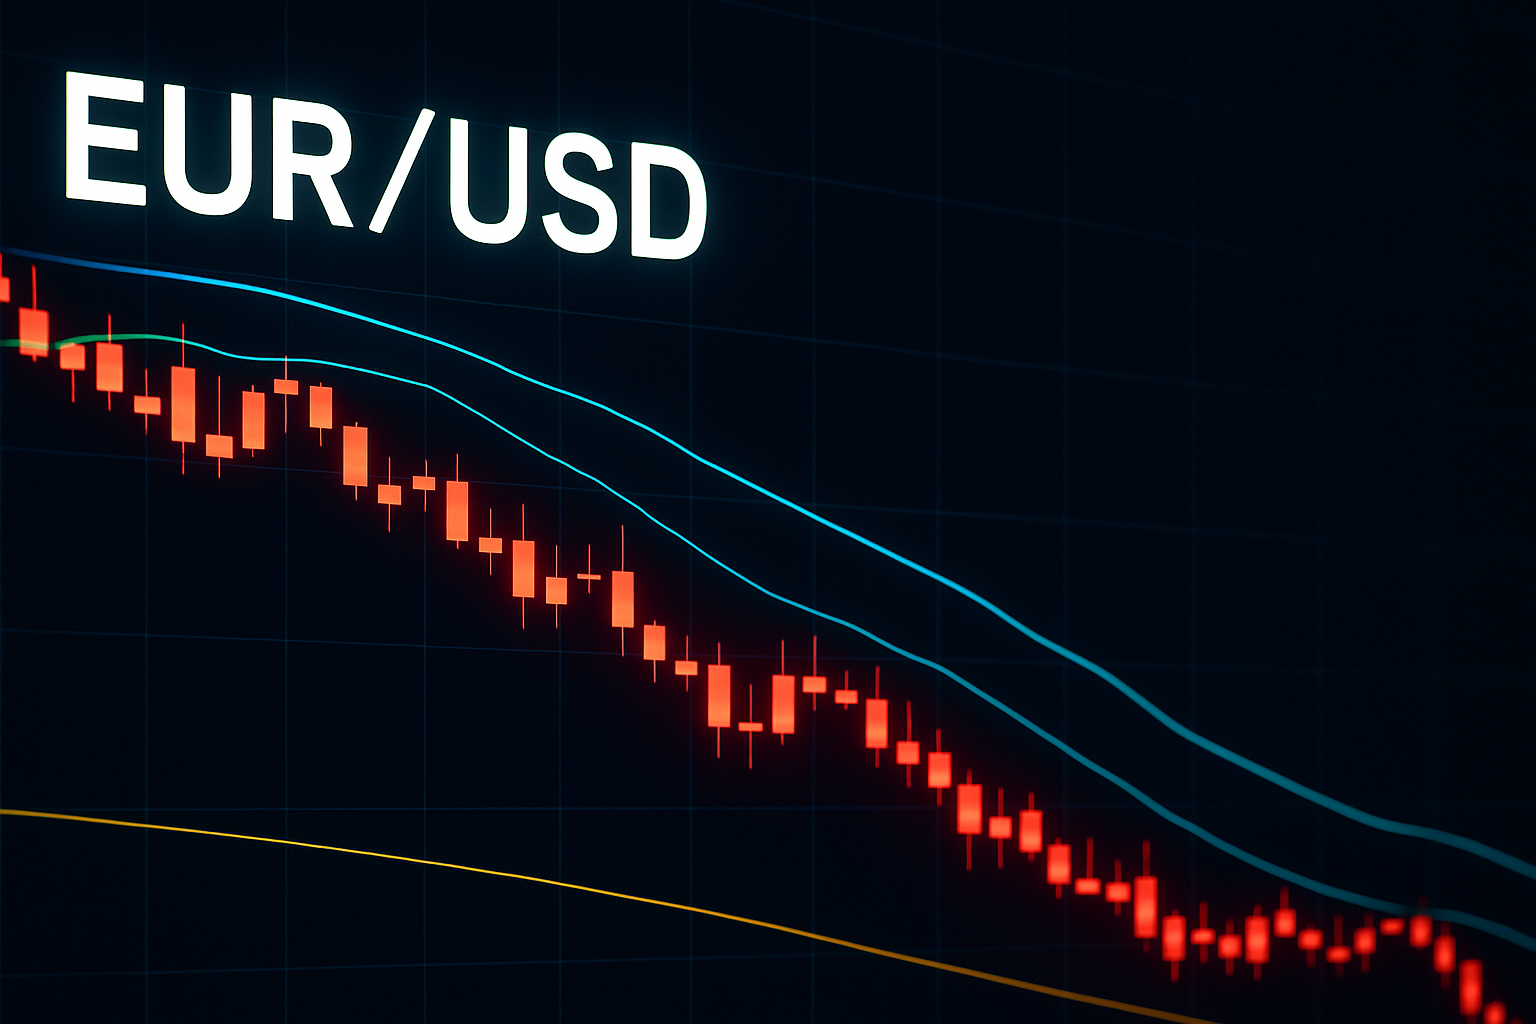
The current trend in EUR/USD appears to be shifting towards bearish territory. Recent price action has confirmed a bearish pattern as the pair struggles to hold above the 0.8750 level. Momentum indicators, such as the Relative Strength Index (RSI), are showing signs of weakness; any readings approaching the oversold territory could suggest a potential reversal. Furthermore, moving averages are beginning to converge, signaling indecision in the market.
Notably, the presence of pivot points indicates critical junctures for traders. The pivot point for this session stands around 0.8745, serving as a crucial level to assess further movements.
Fundamental/News Context
Recent headlines indicate a divide in monetary policy between the European Central Bank (ECB) and the Federal Reserve (Fed). A forecast suggesting that the Euro could rebound above 1.15 relies heavily on these diverging policies. However, today's news also highlights that bearish pressure is returning, which aligns with the current price action observed in EUR/USD.
Additionally, the FX option expiries set for July 13 at 10 am New York time could create volatility, as traders adjust their positions ahead of these expiries. The market is also cautious with global economic data releases influencing sentiment towards the Euro and the Dollar.
Bias
Given the current price action, technical indicators, and the backdrop of diverging central bank policies, the bias for EUR/USD is bearish. The inability to break above the resistance level of 0.8766 raises concerns about the sustainability of any upward movements.
Key Levels to Watch and Short-Term Outlook
Traders should monitor the following key levels:
- Resistance: 0.8766
- Support: 0.8731
- Pivot Point: 0.8745
In the short term, a failure to break above 0.8766 may lead to a retest of the support level at 0.8731, potentially opening the door for further downside. Conversely, a break above resistance could shift the sentiment and provide a bullish opportunity. Given the current bearish bias, traders should be cautious and look for confirmation of a trend reversal before making significant long positions.