
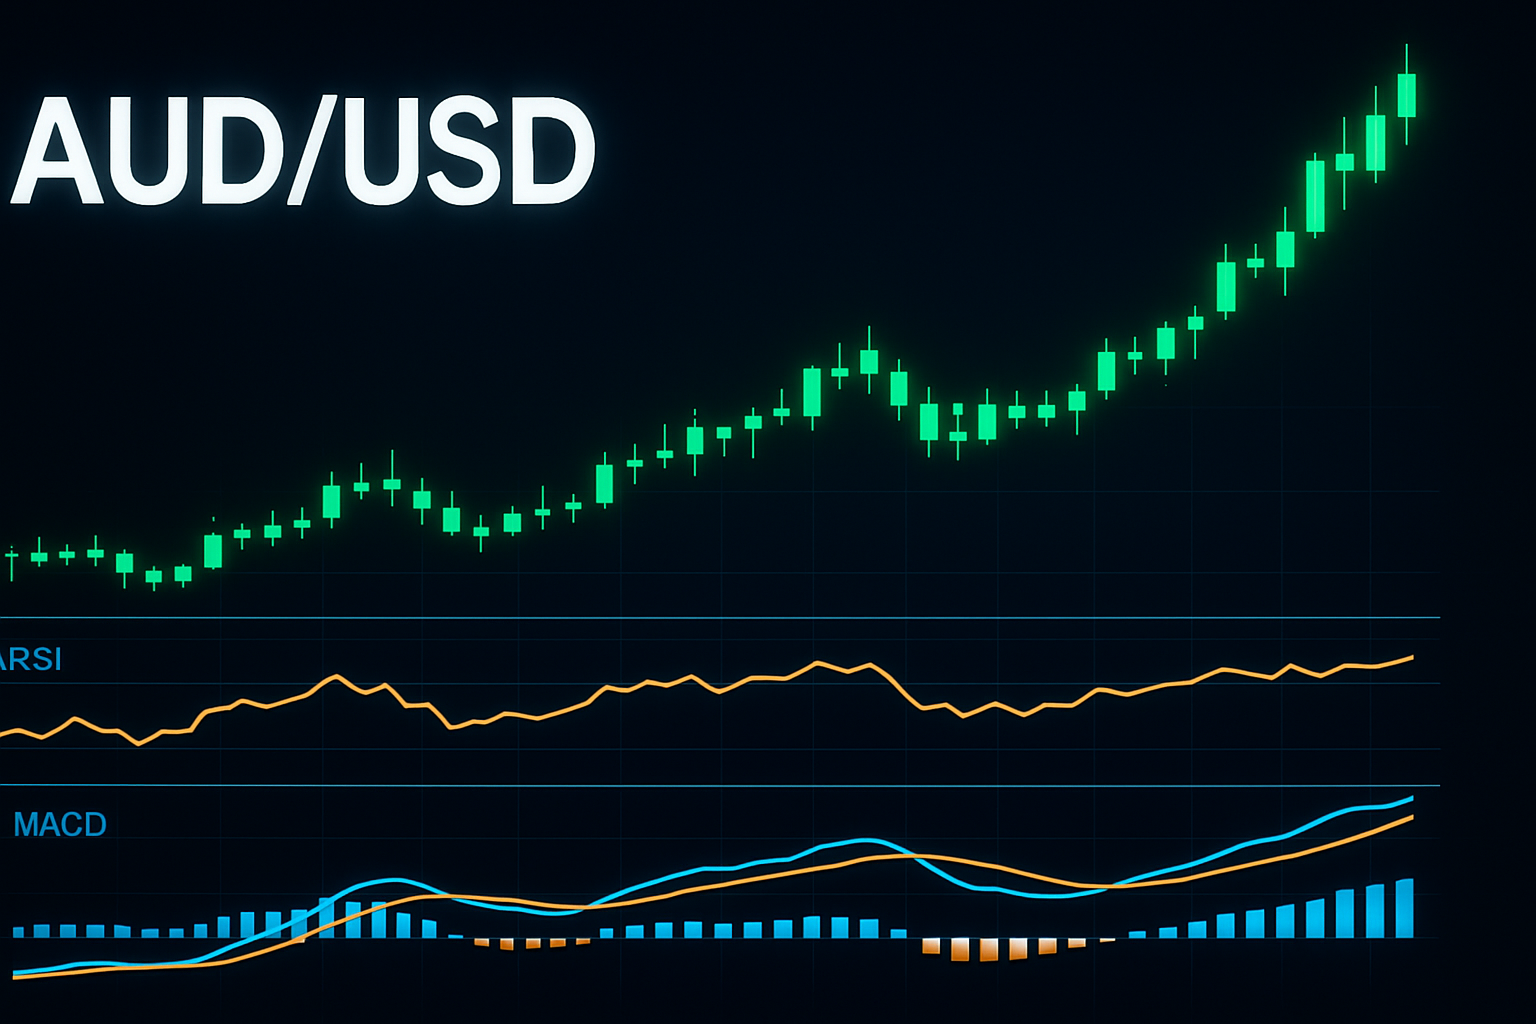
Price Action
The AUD/USD pair is currently trading at 1.4291, reflecting a slight increase of 0.10% from the previous close of 1.4276709. Over the last trading session, the pair reached a high of 1.4319582 and found support at 1.4262418. The recent candlestick patterns show indecision, indicated by a series of small-bodied candles, suggesting that traders are weighing their options amidst mixed market sentiment.
Recent Price Movements
- The previous close at 1.4276709 sets the stage for assessing momentum, with the price hovering near the crucial 1.4319 resistance level.
- A breach above 1.4319 might signal a more substantial bullish trend, while a failure could lead to a retest of the low around 1.4262.
Key Support & Resistance
Key support and resistance levels are critical for determining potential price movements in the AUD/USD pair.
Support Levels
- 1.4262: Recent low acting as immediate support.
- 1.4230: A more significant support level that aligns with previous price action.
Resistance Levels
- 1.4319: Critical resistance; a break above this level may trigger bullish momentum.
- 1.4350: Next resistance zone, identified from Fibonacci retracement levels.
Technical Indicators
Moving Averages
- 20 EMA: Currently at 1.4280, acting as immediate support; a close above this could strengthen bullish sentiment.
- 50 EMA: Positioned at 1.4265, providing further support below the current price.
- 200 EMA: At 1.4210, this longer-term indicator confirms the overall bullish trend in the wider context.
RSI
- The Relative Strength Index (RSI) is currently at 54, indicating a neutral stance but approaching overbought territory, suggesting potential for a reversal or continuation depending on price action.
MACD
- The MACD line is above the signal line, showcasing bullish momentum. However, it is essential to monitor for any signs of divergence that may indicate a shift in momentum.
Fibonacci Retracement
- Key Fibonacci retracement levels are present, with 38.2% retracement at 1.4319 and 61.8% at 1.4230. These levels will be pivotal in determining the market's short-term direction.
Trading Setup
Based on the current analysis, traders may consider the following setup:
- Bullish Scenario: A break and close above 1.4319 could present a buying opportunity, targeting the next resistance at 1.4350.
- Bearish Scenario: Should the price fall below 1.4262, a short position may be considered, targeting lower support at 1.4230.
In conclusion, closely monitoring price action around the key levels of 1.4319 and 1.4262 will be essential for traders looking to capitalize on potential movements in the AUD/USD pair.